Data Analytics Python Streamlit Machine Learning Time Series Neural Networks
Energy Insights Dashboard.
An interactive dashboard for exploring Spain's electricity system, analyzing historical demand and generation, and experimenting with machine learning models to forecast electricity demand.
Hack a Boss bootcamp · Final project · Data analysis and forecasting
Project demo
Watch the project demonstration to see the dashboard and its main features in action.
01. The problem
Electricity demand and generation change over time, influenced by consumption patterns, energy sources and connections between electricity systems. Exploring these changes requires bringing together historical data and clear visualizations.
The goal of this project was to build an interactive application that makes Spanish electricity system data easier to explore. Alongside historical analysis, the project investigates whether machine learning models can identify patterns in electricity demand and use them to generate forecasts.
02. The dataset
The project uses electricity system data from Red Eléctrica de España (REE) , the Spanish electricity system operator.
The dashboard focuses on several aspects of the electricity system:
- Electricity demand: exploring historical demand and changes across selected periods.
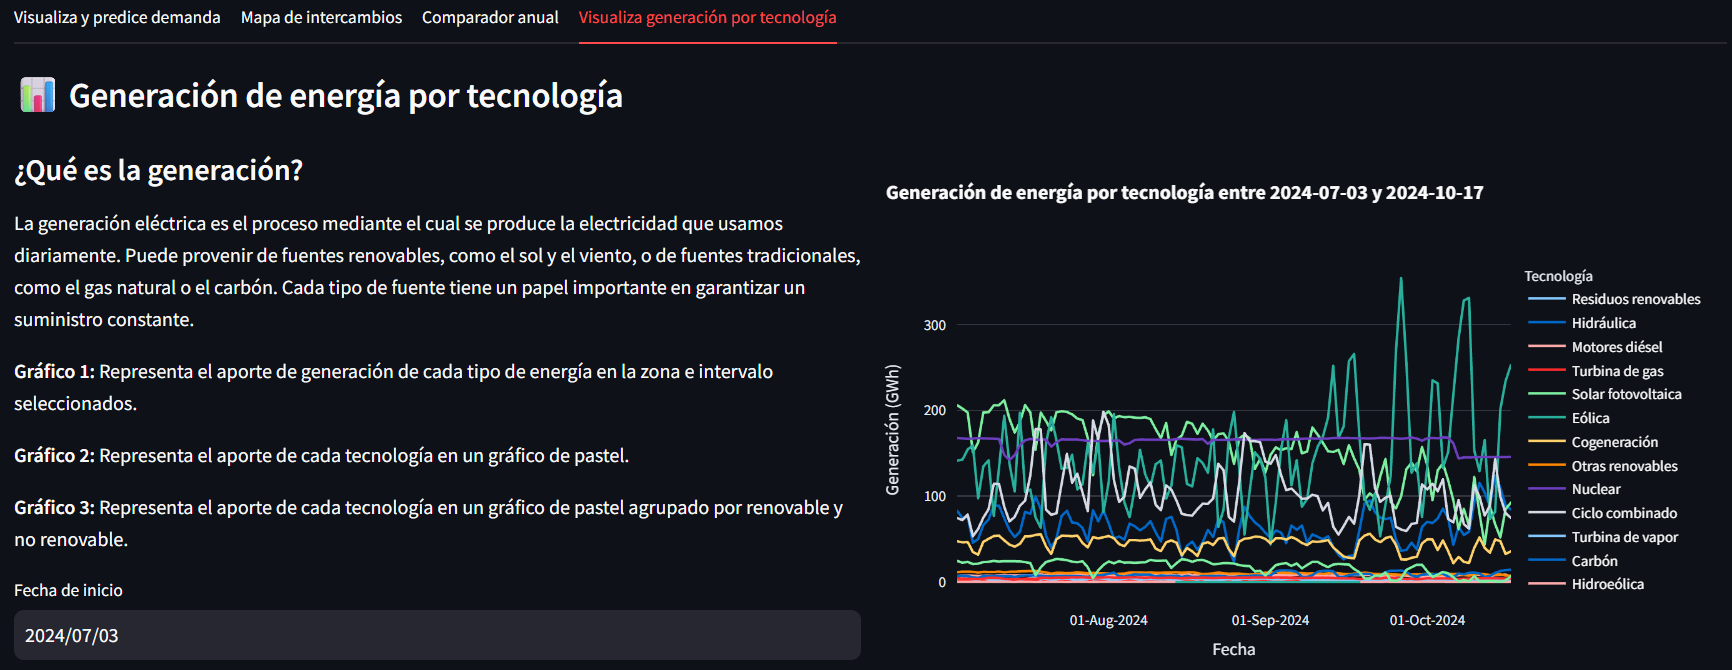
- Generation by technology: examining the contribution of different energy sources.
- Electricity exchanges: visualizing exchanges between Spanish regions and neighboring electricity systems.
- Annual comparisons: comparing historical trends and changes between years.

The project also uses a MySQL database to store and organize data for the application. Dedicated Jupyter notebooks handle database creation and population.
03. Methodology
Data preparation and storage
Python and Pandas are used to process and organize the data, while MySQL provides the database layer. The workflow connects data preparation and storage with the dashboard used for analysis.
Interactive visualization
The application is built with Streamlit and Plotly. It includes sections for the main dashboard, data analysis, machine learning and project information. Users can explore demand, compare annual data, inspect generation by technology and view electricity exchanges through interactive visualizations.
Demand forecasting
The machine learning section explores four forecasting approaches:
- Simple RNN: a recurrent neural network for learning patterns in sequential data.
- LSTM: a recurrent neural network architecture designed to learn dependencies across time.
- GRU: a recurrent architecture that uses gating mechanisms to model sequential patterns.
- Prophet: a time-series forecasting approach used to generate future demand estimates.
The application allows users to explore forecasts over horizons of 7, 15 or 30 days. The recurrent models include two prediction strategies:
- One-step forecasting: predicting an observation from a historical input window.
- Recursive multi-step forecasting: generating successive predictions by feeding previous predictions back into the forecasting process.
Model evaluation includes the coefficient of determination (R²), mean absolute error (MAE) and root mean squared error (RMSE). These metrics help examine prediction quality and compare forecasting experiments.
04. Results
The final application combines historical electricity analysis with demand forecasting experiments. It provides a way to explore the electricity system interactively and investigate how different models behave when predicting future demand.
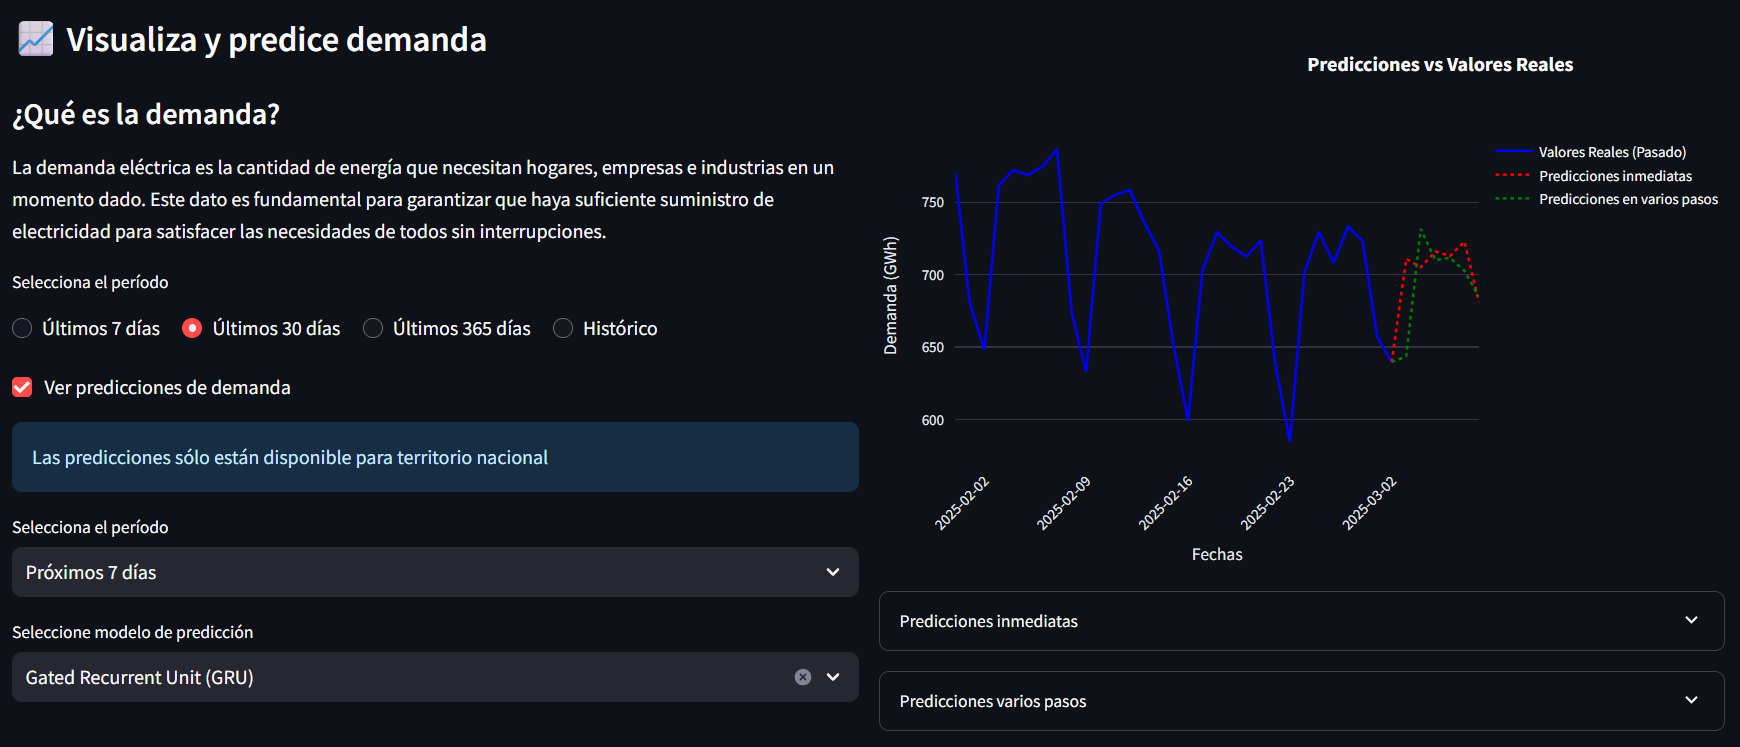
The recorded recurrent-model metrics are shown below. The one-step and recursive multi-step results are presented separately because they represent different forecasting strategies.
Recurrent model experiments
| Model | Strategy | R² | MAE (GWh) | RMSE (GWh) |
|---|---|---|---|---|
| RNN | One-step | 0.400 | 34.53 | 42.39 |
| RNN | Multi-step | -25.900 | 61.52 | 75.85 |
| LSTM | One-step | 0.310 | 34.68 | 41.67 |
| LSTM | Multi-step | -143.240 | 63.68 | 78.53 |
| GRU | One-step | 0.784 | 12.89 | 15.77 |
| GRU | Multi-step | 0.305 | 22.30 | 28.28 |
| Propheth | One-step | 0.7727 | 0.0567 | 0.0787 |
| Propheth | Multi-step | 0.8294 | 0.0512 | 0.0682 |
In these recorded experiments, the Meta Propheth algorithm got the bets metrics followed by the the GRU one-step configuration. The multi-step experiments show a different pattern: performance declines for all architectures except for Propheth, particularly in the recorded RNN and LSTM results.
Negative R² values indicate that the predictions performed worse than a baseline that predicts the mean of the evaluated target values. They highlight the difficulty of recursive forecasting and the importance of validating the prediction process.
These values are reported as experimental results, not as a definitive ranking across all models.
05. What I learned
This project gave me practical experience connecting several stages of a data workflow, from database preparation to visualization and machine learning experimentation.
- Data preparation: organizing real-world data for analysis and use in an application.
- Database integration: using MySQL as part of a Python-based data workflow.
- Data visualization: building interactive charts and maps that make historical patterns easier to explore.
- Machine Learning process: the need of properly preparing the data using feature engineering (using circular encoding for days, months and years, scaling data, and normalize) before train and test the dataset.
- Time-series forecasting: experimenting with Keras using recurrent neural networks and Prophet.
- Model evaluation: using R², MAE and RMSE to investigate model performance.
- Critical evaluation: recognizing that different forecasting strategies can produce very different results and that metrics need consistent evaluation procedures to be meaningfully compared.
An important takeaway was that building a forecasting model is only one part of the process. Understanding how the data is prepared, how predictions are generated and how performance is measured is equally important.
06. Technologies
- Python: core programming language.
- Pandas and NumPy: data manipulation and numerical operations.
- MySQL and SQL: database storage and querying.
- Streamlit: interactive web application.
- Plotly: interactive charts and visualizations.
- Scikit-learn: preprocessing and evaluation metrics.
- TensorFlow / Keras: recurrent neural network models.
- Prophet: time-series forecasting experiments.
- REE API: Spanish electricity system data source.
- Jupyter Notebook: database setup and preparation workflow.
07. Explore the project
Explore the source code, database setup notebooks and application structure in the GitHub repository. You can also open the deployed Streamlit app, if available, to interact with the dashboard.
To run the application locally, follow the setup instructions in the repository README. The documented workflow includes preparing and populating the MySQL database before launching Streamlit.
Final project · Hack a Boss bootcamp